| Measure | Value (anomaly) | Time |
Month cumul. | Record High | Record Low |
| Minimum Temperature |
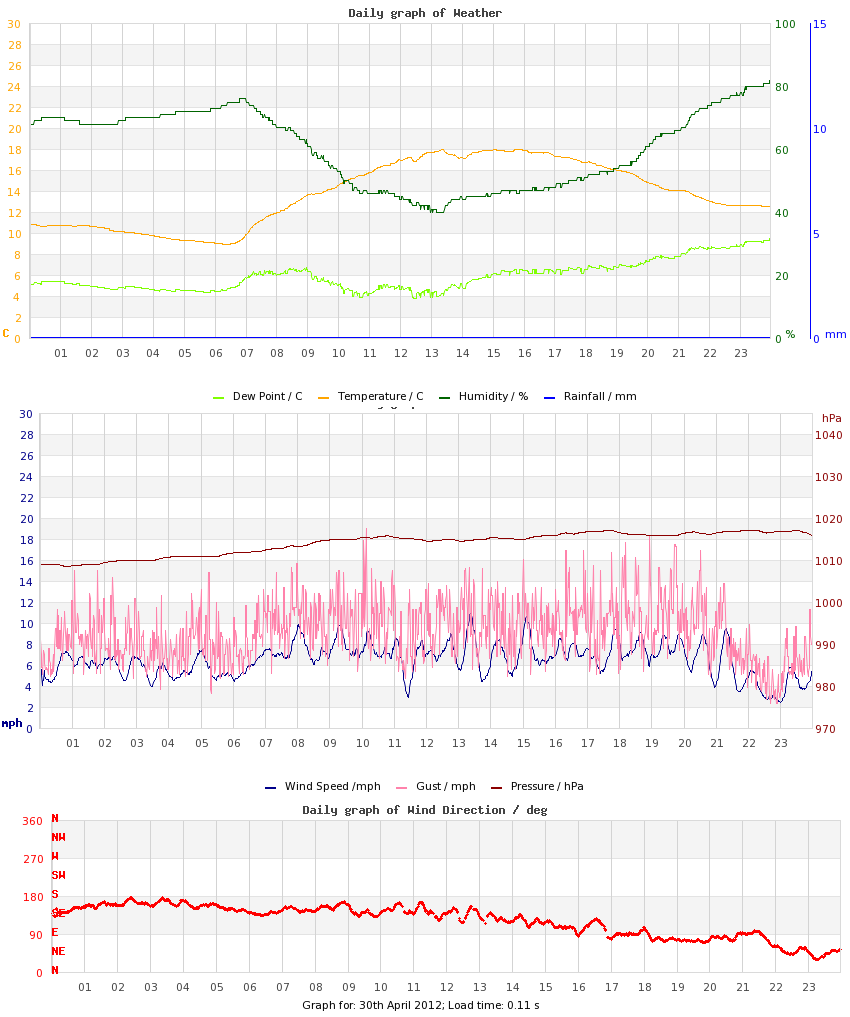
8.9 °C (+1.8) |
06:22 |
4.8 °C (-1.4) |
10.9 °C (+3.8), 2011 |
1.8 °C (-5.3), 2021 |
| Maximum Temperature |
18.0 °C (+1.9) |
14:38 |
12.7 °C (-1.9) |
20.4 °C (+4.3), 2014 |
8.7 °C (-7.4), 2018 |
| Mean Temperature |
13.7 °C (+1.9) |
|
8.5 °C (-1.6) |
15.1 °C, 2011 |
6.4 °C, 2018 |
| Minimum Humidity |
40% |
13:11 |
51% |
62%, 2018 |
36%, 2013 |
| Maximum Humidity |
82% |
23:58 |
90% |
97%, 2014 |
71%, 2017 |
| Mean Humidity |
61% |
|
73% |
83%, 2020 |
52%, 2017 |
| Minimum Pressure |
1007 hPa |
00:43 |
1000 hPa |
1027 hPa, 2022 |
993 hPa, 2020 |
| Maximum Pressure |
1016 hPa |
19:50 |
1009 hPa |
1033 hPa, 2022 |
998 hPa, 2020 |
| Mean Pressure |
1012 hPa |
|
1004 hPa |
1030 hPa, 2022 |
996 hPa, 2020 |
| Mean Wind Speed |
7.5 mph (+2.6) |
|
5.5 mph (+0.6) |
7.9 mph, 2018 |
0.9 mph, 2022 |
| Maximum Wind Speed |
17.3 mph |
|
15.2 mph |
18.1 mph, 2011 |
7.0 mph, 2022 |
| Maximum Gust |
21.9 mph |
10:08 |
21.9 mph |
30.0 mph, 2020 |
11.5 mph, 2019 |
| Mean Wind Direction |
ESE |
|
|
|
|
| Rainfall |
trace |
|
100.4 mm (239%) |
10.9, 2020 |
|
| Maximum Hourly Rain |
n/a |
|
|
4.6, 2020 |
|
| Maximum 10-min Rain |
n/a |
|
|
1.5, 2020 |
|
| Maximum Rain Rate |
n/a |
|
|
30, 2010 |
|
| Minimum Dew Point |
3.6 °C |
12:28 |
0.5 °C |
5.9 °C, 2010 |
-3.1 °C, 2016 |
| Maximum Dew Point |
9.5 °C |
23:58 |
6.7 °C |
12.5 °C, 2014 |
2.9 °C, 2013 |
| Mean Dew Point |
5.9 °C |
|
3.5 °C |
8.1 °C, 2023 |
-0.9 °C, 2016 |
| Measure | Value | Time |
Month cumul. | Record High | Record Low |
| Night Minimum (21-09) |
8.9 °C |
06:22 |
5.0 °C |
10.9 °C, 2011 |
1.8 °C, 2021 |
| Day Maximum (09-21) |
18.0 °C |
14:37 |
12.6 °C |
20.4 °C, 2014 |
8.7 °C, 2018 |
| Max 10m Temp Rise |
0.6 °C |
07:07 |
0.7 °C |
0.9 °C, 2021 |
0.4 °C, 2011 |
| Max 1hr Temp Rise |
2.6 °C |
07:39 |
2.5 °C |
3.6 °C, 2022 |
0.9 °C, 2018 |
| Max 1hr Hum Rise |
10% |
20:26 |
11% |
21%, 2021 |
5%, 2009 |
| Max 10m Temp Fall |
0.5 °C |
13:33 |
0.8 °C |
1.2 °C, 2020 |
0.3 °C, 2018 |
| Max 1hr Temp Fall |
1.4 °C |
20:16 |
2.1 °C |
4.1 °C, 2020 |
0.9 °C, 2018 |
| Max 1hr Hum Fall |
11% |
10:27 |
14% |
20%, 2014 |
6%, 2017 |
| Max 10m Wind Speed |
10.9 mph |
13:23 |
10.0 mph |
14.1 mph, 2020 |
5.2 mph, 2022 |
| Minimum Feels-like |
6.1 °C |
06:24 |
1.8 °C |
11.3 °C, 2011 |
-1.2 °C, 2018 |
| Maximum Feels-like |
18.0 °C |
13:19 |
12.7 °C |
20.4 °C, 2014 |
8.0 °C, 2018 |
| Mean Feels-like |
13.6 °C |
|
7.4 °C |
15.4 °C, 2011 |
2.8 °C, 2018 |
| Air-frost Hrs |
0 hrs |
|
0.2 hrs |
0 hrs, 2009 |
0 hrs, 2009 |
| Measure | Value (anomaly) |
Month cumul. | Record High | Record Low |
| Temperature Range |
9.1 °C (+0.1) |
7.9 °C (-0.6) |
14.5 °C (+5.5), 2022 |
4.0 °C (-5.0), 2018 |
| Humidity Range |
42% |
39% |
60%, 2014 |
24%, 2009 |
| Pressure Range |
9 hPa |
9 hPa |
13 hPa, 2016 |
2 hPa, 2021 |
| Measure | Value [% of max] |
Month cumul. | Record High | Record Low |
| Sun Hours |
10 [75%] | 118 hrs (73%) [31%] |
13.4 [100%], 2011 |
0 [0%], 2018 |
| Wet Hours |
1 | 104 hrs (227%) [14%] |
12, 2018 |
0, 2011 |
| Cloud Cover |
am: Sunny or Mostly Sunny
pm: Mostly Sunny transitioned to Hazy |
| Events |
None |
| Comments |
21, 23 Light/Moderate Showers |
| Extra Comments |
|
| Issues |
None known |
| Observer Absent? |
Yes - observations may be unreliable |
| Pond Temperature (Heath) |
0.0 °C |