| Measure | Value (anomaly) | Time |
Month cumul. | Record High | Record Low |
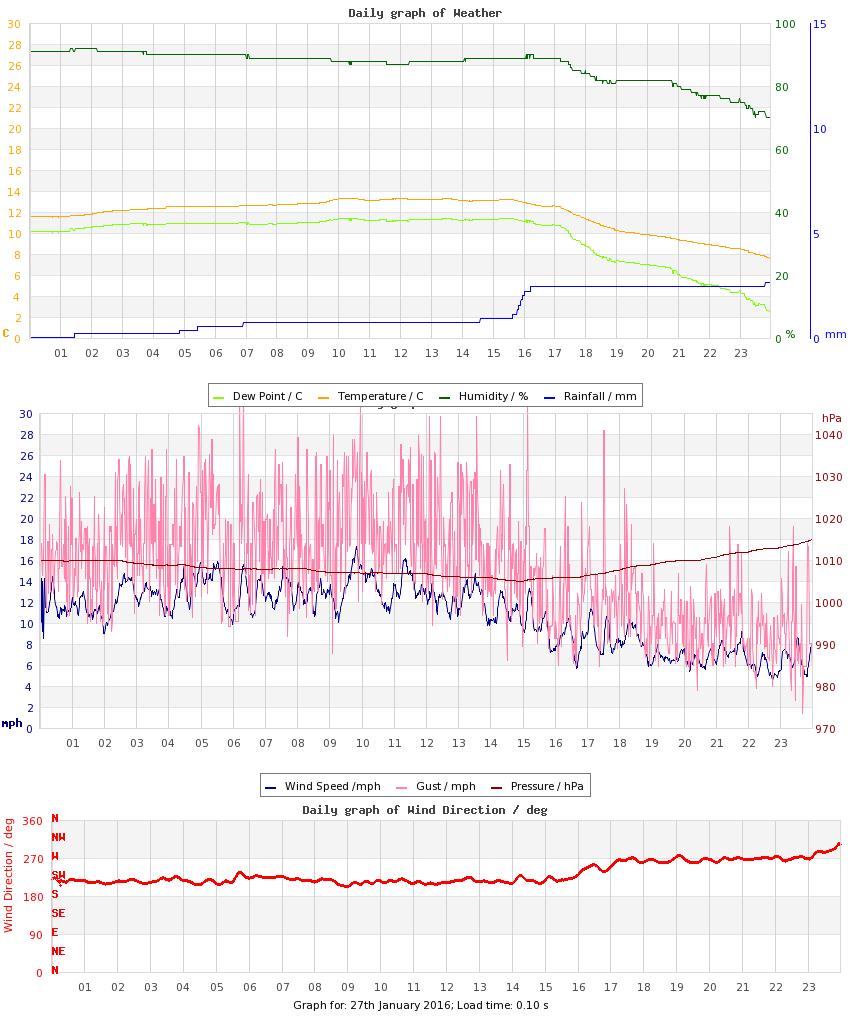
| Minimum Temperature |
7.6 °C (+4.7) |
23:58 |
3.7 °C (+0.7) |
7.6 °C (+4.7), 2016 |
-2.7 °C (-5.6), 2010 |
| Maximum Temperature |
13.3 °C (+5.5) |
11:49 |
8.5 °C (+0.7) |
13.3 °C (+5.5), 2016 |
2.6 °C (-5.2), 2011 |
| Mean Temperature |
11.8 °C (+5.1) |
|
6.3 °C (+0.7) |
11.8 °C, 2016 |
1.5 °C, 2010 |
| Minimum Humidity |
70% |
23:44 |
75% |
92%, 2021 |
49%, 2013 |
| Maximum Humidity |
92% |
01:44 |
91% |
98%, 2010 |
78%, 2011 |
| Mean Humidity |
87% |
|
85% |
95%, 2021 |
68%, 2011 |
| Minimum Pressure |
1005 hPa |
14:30 |
1002 hPa |
1030 hPa, 2023 |
984 hPa, 2019 |
| Maximum Pressure |
1016 hPa |
23:48 |
1012 hPa |
1040 hPa, 2010 |
992 hPa, 2014 |
| Mean Pressure |
1008 hPa |
|
1007 hPa |
1034 hPa, 2024 |
989 hPa, 2014 |
| Mean Wind Speed |
10.7 mph (+5.5) |
|
5.6 mph (+0.4) |
10.7 mph, 2016 |
1.4 mph, 2021 |
| Maximum Wind Speed |
21.9 mph |
09:57 |
14.5 mph |
21.9 mph, 2016 |
8.2 mph, 2021 |
| Maximum Gust |
33.4 mph |
06:12 |
21.4 mph |
33.4 mph, 2016 |
13.5 mph, 2012 |
| Mean Wind Direction |
SW |
|
|
|
|
| Rainfall |
2.6 mm |
|
64.3 mm (125%) |
8.4 mm, 2020 |
|
| Maximum Hourly Rain |
1.5 mm |
16:13 |
|
4.4 mm, 2020 |
|
| Maximum 10-min Rain |
0.7 mm |
16:01 |
|
1.5 mm, 2020 |
|
| Maximum Rain Rate |
6 mm/h |
15:55 |
|
30 mm/h, 2020 |
|
| Minimum Dew Point |
2.5 °C |
23:58 |
1.1 °C |
5.7 °C, 2021 |
-6.0 °C, 2011 |
| Maximum Dew Point |
11.4 °C |
12:49 |
6.2 °C |
11.4 °C, 2016 |
-1.7 °C, 2011 |
| Mean Dew Point |
9.6 °C |
|
3.9 °C |
9.6 °C, 2016 |
-3.7 °C, 2011 |
| Measure | Value | Time |
Month cumul. | Record High | Record Low |
| Night Minimum (21-09) |
* 11.5 °C * |
00:49 |
4.3 °C |
11.5 °C, 2016 |
-2.7 °C, 2010 |
| Day Maximum (09-21) |
13.3 °C |
11:49 |
8.3 °C |
13.3 °C, 2016 |
2.6 °C, 2011 |
| Max 10m Temp Rise |
0.2 °C |
02:11 |
0.3 °C |
0.8 °C, 2024 |
0.1 °C, 2011 |
| Max 1hr Temp Rise |
0.5 °C |
02:41 |
1.2 °C |
3.0 °C, 2024 |
0.5 °C, 2011 |
| Max 1hr Hum Rise |
1% |
01:18 |
4% |
13%, 2012 |
1%, 2016 |
| Max 10m Temp Fall |
0.4 °C |
17:36 |
0.3 °C |
1.2 °C, 2012 |
0.2 °C, 2010 |
| Max 1hr Temp Fall |
1.4 °C |
18:11 |
1.1 °C |
2.8 °C, 2012 |
0.3 °C, 2017 |
| Max 1hr Hum Fall |
6% |
18:09 |
6% |
18%, 2013 |
2%, 2021 |
| Max 10m Wind Speed |
17.3 mph |
09:49 |
10.6 mph |
17.3 mph, 2016 |
6.3 mph, 2021 |
| Minimum Feels-like |
3.7 °C |
23:52 |
0.6 °C |
3.7 °C, 2016 |
-5.0 °C, 2011 |
| Maximum Feels-like |
15.3 °C |
09:59 |
8.5 °C |
15.3 °C, 2016 |
1.9 °C, 2011 |
| Mean Feels-like |
12.7 °C |
|
4.8 °C |
12.7 °C, 2016 |
-2.6 °C, 2011 |
| Air-frost Hrs |
0 hrs |
|
1 hrs |
8 hrs, 2010 |
0 hrs, 2011 |
| Measure | Value (anomaly) |
Month cumul. | Record High | Record Low |
| Temperature Range |
5.7 °C (+0.9) |
4.8 °C (+0.0) |
8.7 °C (+3.9), 2017 |
1.5 °C (-3.3), 2011 |
| Humidity Range |
22% |
15% |
49%, 2013 |
4%, 2021 |
| Pressure Range |
11 hPa |
10 hPa |
23 hPa, 2010 |
2 hPa, 2023 |
| Measure | Value [% of max] |
Month cumul. | Record High | Record Low |
| Sun Hours |
0 [0%] | 47 hrs (79%) [23%] |
7.5 [95%], 2012 |
0 [0%], 2010 |
| Wet Hours |
4
[Mean rain rate: 0.7 mm/h] | 77 hrs (132%) [12%] |
7, 2013 |
, 2009 |
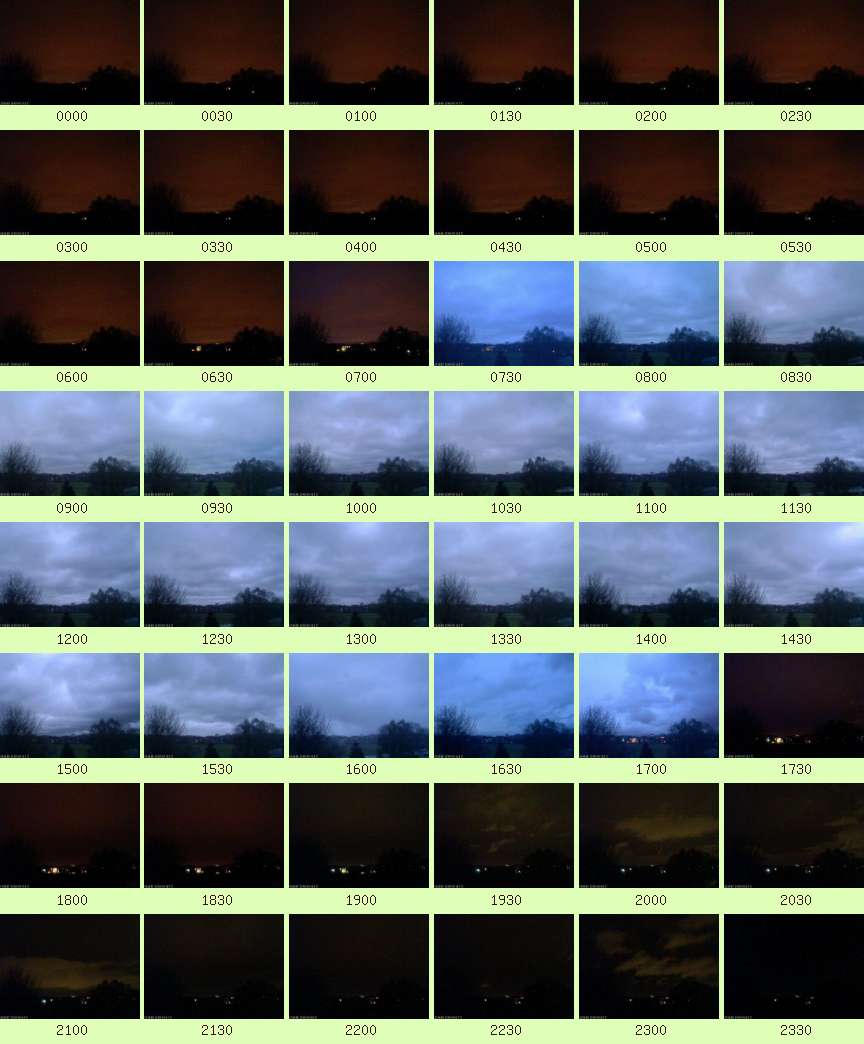
| Cloud Cover |
Overcast |
| Events |
None |
| Comments |
o.night Rain, aft Showers |
| Extra Comments |
|
| Issues |
None known |
| Observer Absent? |
Yes - observations may be unreliable |
| Pond Temperature (Heath) |
0.0 °C |


 Large resolution version
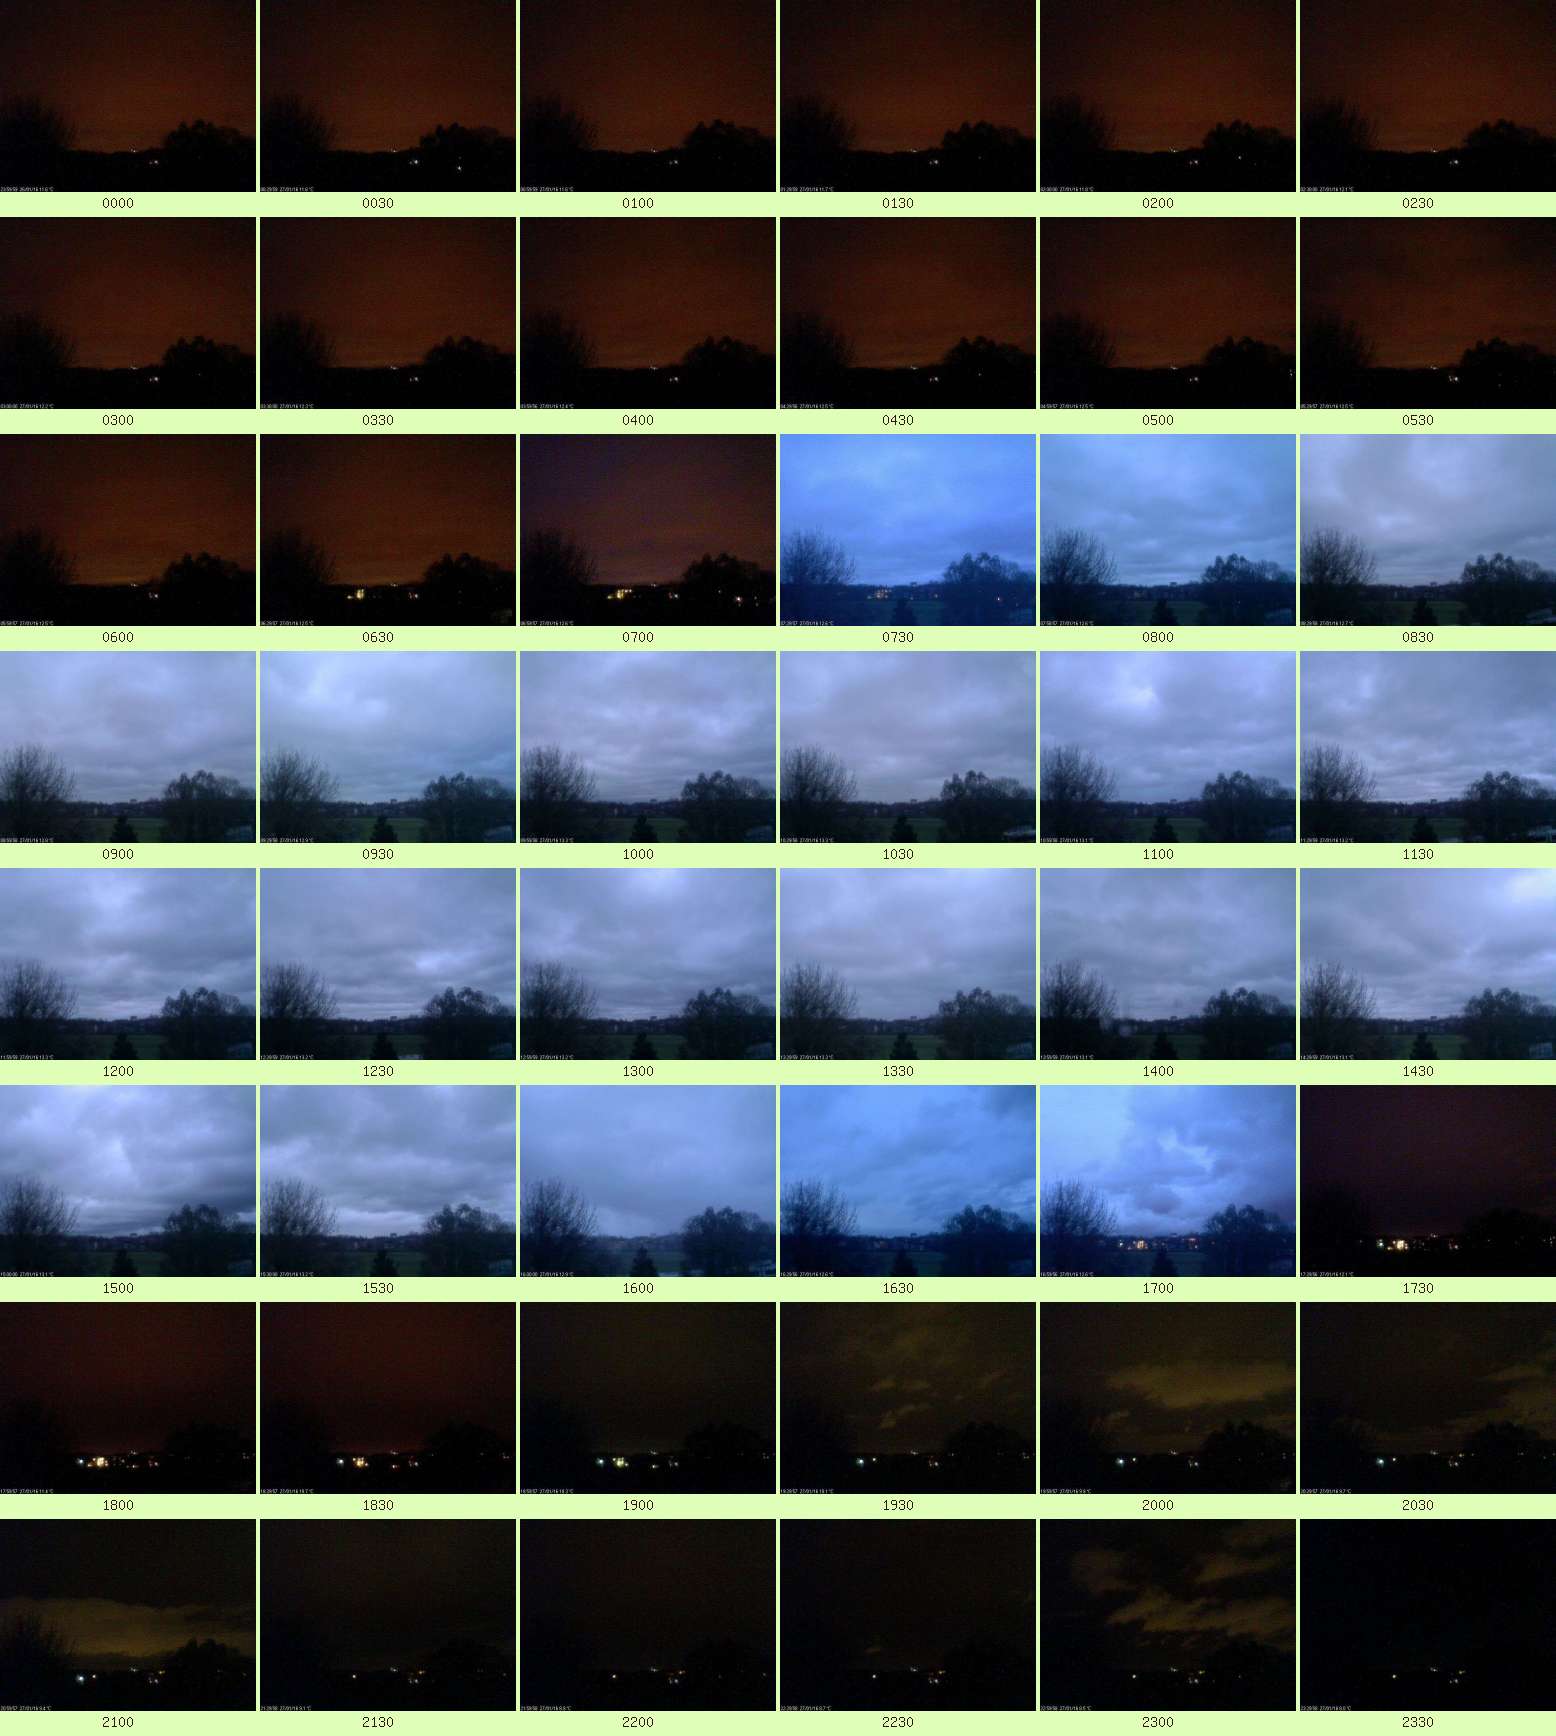