| Measure | Value (anomaly) | Time |
Month cumul. | Record High | Record Low |
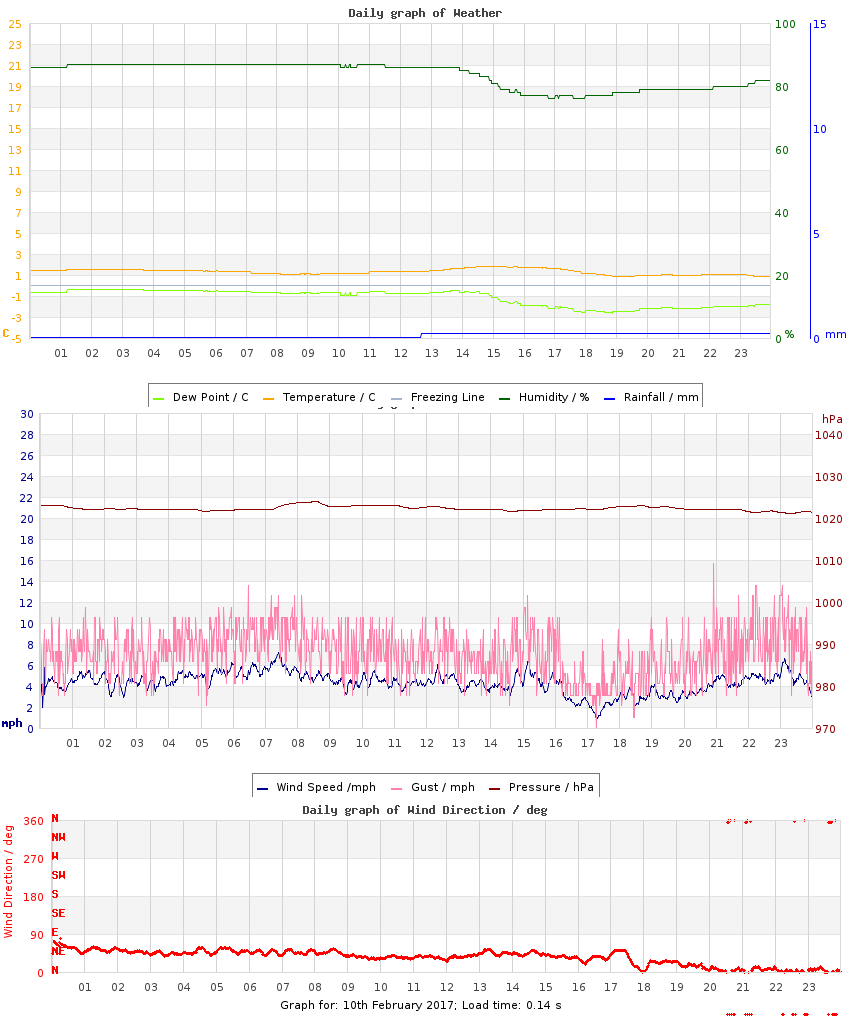
| Minimum Temperature |
0.9 °C (-2.0) |
21:25 |
3.8 °C (+0.8) |
8.3 °C (+5.4), 2011 |
-5.1 °C (-8.0), 2012 |
| Maximum Temperature |
1.8 °C (-6.1) |
15:07 |
7.5 °C (-0.4) |
11.4 °C (+3.5), 2024 |
1.6 °C (-6.3), 2012 |
| Mean Temperature |
1.3 °C (-4.1) |
|
5.8 °C (+0.2) |
9.8 °C, 2024 |
-0.7 °C, 2012 |
| Minimum Humidity |
76% |
17:22 |
72% |
89%, 2013 |
55%, 2009 |
| Maximum Humidity |
87% |
06:20 |
86% |
98%, 2009 |
83%, 2016 |
| Mean Humidity |
84% |
|
80% |
95%, 2013 |
75%, 2016 |
| Minimum Pressure |
1021 hPa |
14:27 |
1006 hPa |
1037 hPa, 2012 |
977 hPa, 2009 |
| Maximum Pressure |
1024 hPa |
07:56 |
1015 hPa |
1039 hPa, 2012 |
986 hPa, 2024 |
| Mean Pressure |
1022 hPa |
|
1010 hPa |
1038 hPa, 2012 |
984 hPa, 2024 |
| Mean Wind Speed |
4.3 mph (-0.8) |
|
4.1 mph (-1.0) |
12.9 mph, 2020 |
1.9 mph, 2012 |
| Maximum Wind Speed |
9.4 mph |
07:20 |
11.1 mph |
28.0 mph, 2020 |
8.3 mph, 2024 |
| Maximum Gust |
15.7 mph |
20:55 |
17.2 mph |
46.1 mph, 2020 |
10.9 mph, 2012 |
| Mean Wind Direction |
NE |
|
|
|
|
| Rainfall / Snow-melt approx. |
0.2 mm |
|
13.5 mm (84%) |
12.9 mm, 2013 |
|
| Maximum Hourly Rain |
0.2 mm |
|
|
4.2 mm, 2020 |
|
| Maximum 10-min Rain |
0.2 mm |
|
|
2.0 mm, 2020 |
|
| Maximum Rain Rate |
n/a |
|
|
30, 2020 |
|
| Minimum Dew Point |
-2.7 °C |
18:51 |
0.5 °C |
7.0 °C, 2024 |
-8.6 °C, 2012 |
| Maximum Dew Point |
-0.4 °C |
02:26 |
4.4 °C |
10.1 °C, 2011 |
-2.4 °C, 2021 |
| Mean Dew Point |
-1.2 °C |
|
2.6 °C |
8.5 °C, 2011 |
-4.1 °C, 2012 |
| Measure | Value | Time |
Month cumul. | Record High | Record Low |
| Night Minimum (21-09) |
* 1.1 °C * |
08:31 |
4.2 °C |
8.4 °C, 2024 |
-1.8 °C, 2021 |
| Day Maximum (09-21) |
1.8 °C |
15:07 |
7.4 °C |
11.4 °C, 2024 |
1.6 °C, 2012 |
| Max 10m Temp Rise |
0.1 °C |
01:11 |
0.3 °C |
0.8 °C, 2023 |
0.1 °C, 2011 |
| Max 1hr Temp Rise |
0.3 °C |
13:38 |
0.9 °C |
2.4 °C, 2023 |
0.3 °C, 2017 |
| Max 1hr Hum Rise |
2% |
18:52 |
4% |
15%, 2010 |
2%, 2015 |
| Max 10m Temp Fall |
0.1 °C |
03:41 |
0.3 °C |
1.7 °C, 2020 |
0.1 °C, 2011 |
| Max 1hr Temp Fall |
0.4 °C |
17:51 |
0.9 °C |
3.6 °C, 2020 |
0.4 °C, 2011 |
| Max 1hr Hum Fall |
6% |
15:32 |
5% |
14%, 2014 |
2%, 2011 |
| Max 10m Wind Speed |
7.2 mph |
07:25 |
8.8 mph |
19.5 mph, 2020 |
5.6 mph, 2024 |
| Minimum Feels-like |
-4.7 °C |
20:55 |
0.9 °C |
6.5 °C, 2024 |
-8.4 °C, 2012 |
| Maximum Feels-like |
1.8 °C |
14:35 |
7.5 °C |
12.4 °C, 2024 |
-0.1 °C, 2021 |
| Mean Feels-like |
-2.0 °C |
|
4.4 °C |
9.7 °C, 2024 |
-4.1 °C, 2021 |
| Air-frost Hrs |
0 hrs |
|
0 hrs |
16 hrs, 2021 |
0 hrs, 2011 |
| Measure | Value (anomaly) |
Month cumul. | Record High | Record Low |
| Temperature Range |
0.9 °C (-4.1) |
3.7 °C (-1.3) |
10.6 °C (+5.6), 2018 |
0.9 °C (-4.1), 2017 |
| Humidity Range |
11% |
14% |
43%, 2009 |
9%, 2013 |
| Pressure Range |
3 hPa |
9 hPa |
36 hPa, 2009 |
2 hPa, 2012 |
| Measure | Value [% of max] |
Month cumul. | Record High | Record Low |
| Sun Hours |
0 [0%] | 9.6 hrs (36%) [11%] |
5 [58%], 2021 |
0 [0%], 2011 |
| Wet Hours |
8 | 34 hrs (183%) [14%] |
23, 2013 |
, 2009 |
| Cloud Cover |
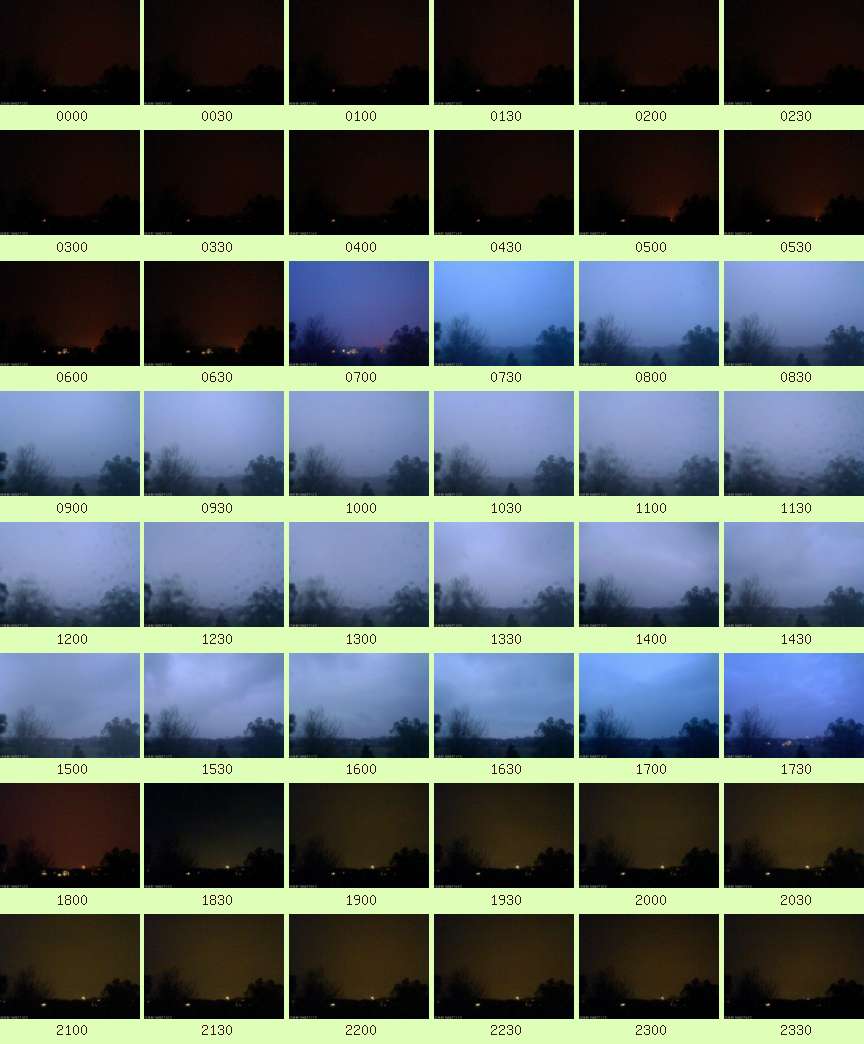
Overcast |
| Events |
Snowfall: trace amount |
| Comments |
Periods of Rain,Drizzle,Snow throughout |
| Extra Comments |
|
| Issues |
None known |
| Observer Absent? |
Yes - observations may be unreliable |
| Pond Temperature (Heath) |
0.0 °C |


 Large resolution version
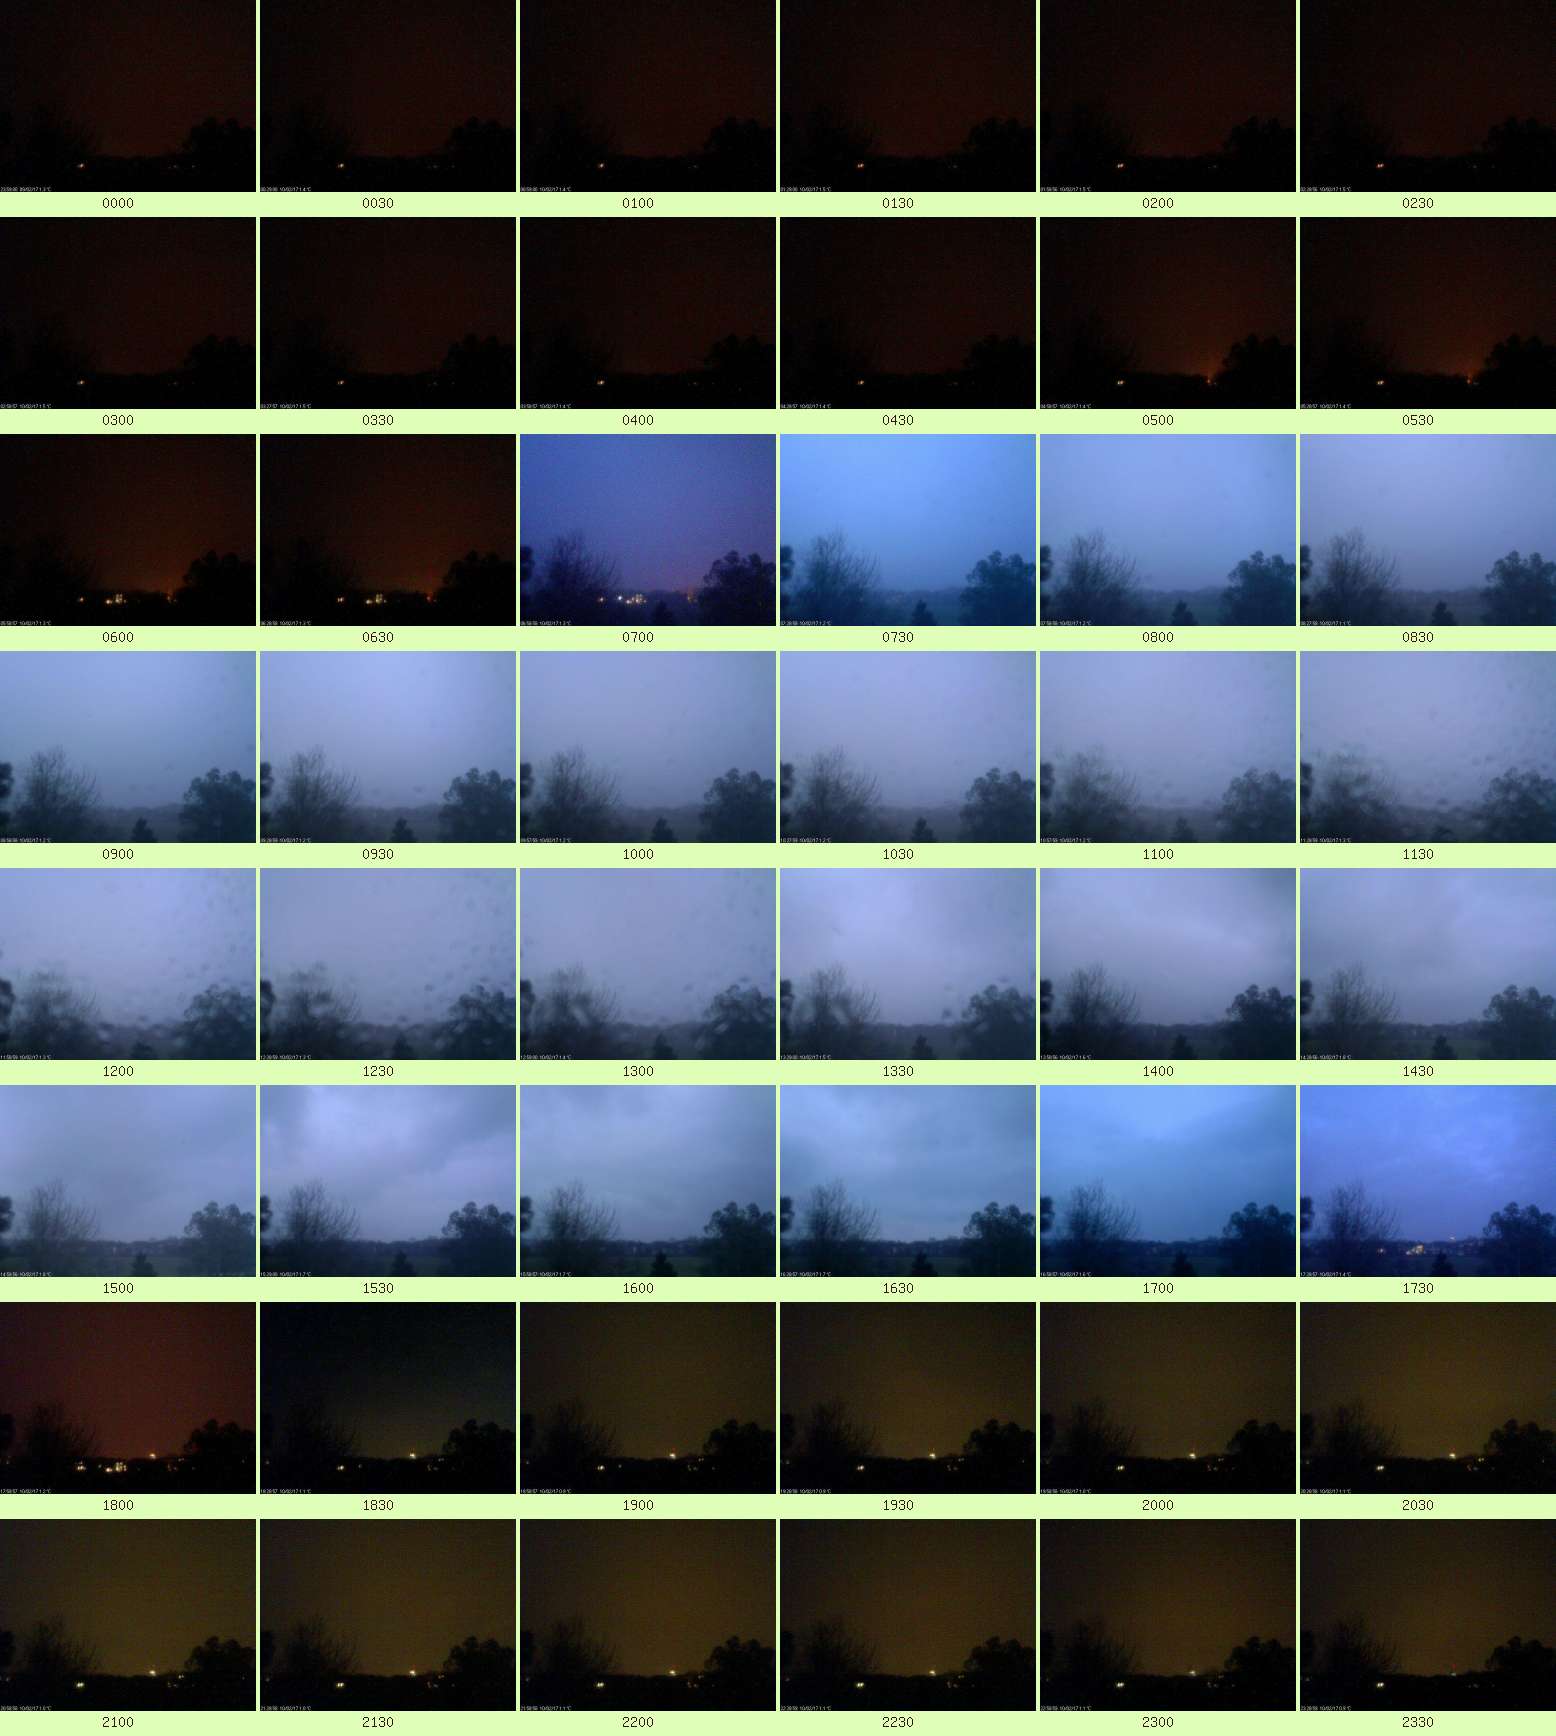