| Measure | Value (anomaly) | Time |
Month cumul. | Record High | Record Low |
| Minimum Temperature |
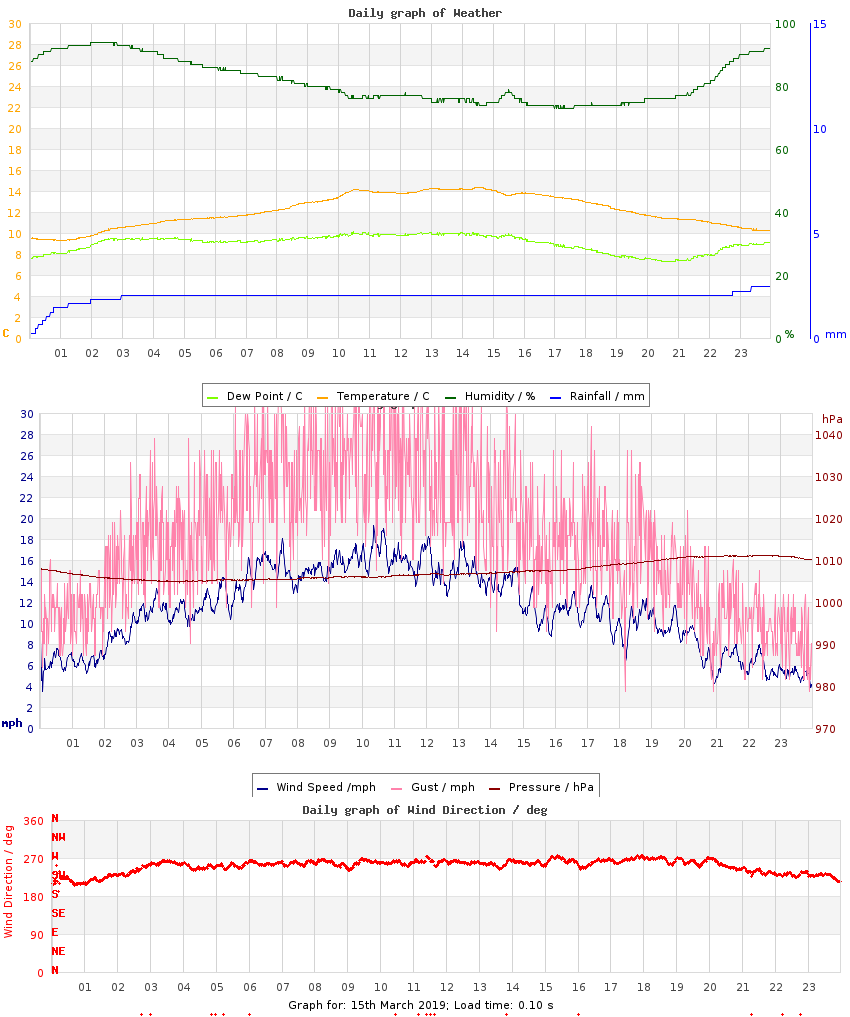
9.3 °C (+5.0) |
01:01 |
5.9 °C (+2.1) |
9.3 °C (+5.0), 2019 |
-0.7 °C (-5.0), 2023 |
| Maximum Temperature |
14.4 °C (+3.6) |
14:32 |
11.6 °C (+1.3) |
17.2 °C (+6.4), 2014 |
6.8 °C (-4.0), 2015 |
| Mean Temperature |
12.1 °C (+4.3) |
|
8.8 °C (+1.7) |
12.4 °C, 2024 |
4.1 °C, 2025 |
| Minimum Humidity |
73% |
17:24 |
61% |
77%, 2011 |
32%, 2014 |
| Maximum Humidity |
94% |
02:19 |
90% |
98%, 2011 |
79%, 2014 |
| Mean Humidity |
82% |
|
79% |
91%, 2011 |
58%, 2014 |
| Minimum Pressure |
1005 hPa |
04:13 |
1000 hPa |
1028 hPa, 2016 |
988 hPa, 2018 |
| Maximum Pressure |
1011 hPa |
22:23 |
1012 hPa |
1036 hPa, 2017 |
993 hPa, 2018 |
| Mean Pressure |
1007 hPa |
|
1006 hPa |
1033 hPa, 2017 |
991 hPa, 2018 |
| Mean Wind Speed |
11.3 mph (+6.1) |
|
8.8 mph (+3.6) |
11.3 mph, 2019 |
1.8 mph, 2017 |
| Maximum Wind Speed |
24.1 mph |
09:03 |
21.5 mph |
24.1 mph, 2019 |
7.7 mph, 2017 |
| Maximum Gust |
47.2 mph |
09:45 |
35.4 mph |
47.2 mph, 2019 |
10.5 mph, 2017 |
| Mean Wind Direction |
WSW |
|
|
|
|
| Rainfall |
2.6 mm |
|
42.5 mm (225%) |
4.8 mm, 2018 |
|
| Maximum Hourly Rain |
1.5 mm |
01:01 |
|
1.5 mm, 2018 |
|
| Maximum 10-min Rain |
0.4 mm |
00:11 |
|
0.6 mm, 2013 |
|
| Maximum Rain Rate |
2.6 mm/h |
00:16 |
|
7 mm/h, 2024 |
|
| Minimum Dew Point |
7.3 °C |
20:40 |
2.6 °C |
7.3 °C, 2019 |
-5.4 °C, 2013 |
| Maximum Dew Point |
10.2 °C |
10:28 |
7.8 °C |
11.8 °C, 2024 |
1.3 °C, 2025 |
| Mean Dew Point |
9.0 °C |
|
5.2 °C |
9.9 °C, 2024 |
-1.6 °C, 2025 |
| Measure | Value | Time |
Month cumul. | Record High | Record Low |
| Night Minimum (21-09) |
9.3 °C |
01:01 |
6.3 °C |
11.4 °C, 2024 |
-0.7 °C, 2023 |
| Day Maximum (09-21) |
14.4 °C |
14:32 |
11.6 °C |
17.2 °C, 2014 |
6.8 °C, 2015 |
| Max 10m Temp Rise |
0.3 °C |
10:11 |
0.5 °C |
0.9 °C, 2012 |
0.2 °C, 2015 |
| Max 1hr Temp Rise |
1.2 °C |
10:28 |
1.7 °C |
4.0 °C, 2012 |
0.6 °C, 2015 |
| Max 1hr Hum Rise |
9% |
22:48 |
11% |
13%, 2021 |
4%, 2011 |
| Max 10m Temp Fall |
0.3 °C |
15:25 |
0.7 °C |
1.2 °C, 2020 |
0.2 °C, 2015 |
| Max 1hr Temp Fall |
0.8 °C |
15:25 |
1.7 °C |
2.8 °C, 2020 |
0.6 °C, 2015 |
| Max 1hr Hum Fall |
5% |
16:30 |
11% |
20%, 2012 |
2%, 2016 |
| Max 10m Wind Speed |
19.3 mph |
10:22 |
16.0 mph |
19.3 mph, 2019 |
6.0 mph, 2017 |
| Minimum Feels-like |
6.1 °C |
00:19 |
1.5 °C |
6.5 °C, 2017 |
-4.0 °C, 2025 |
| Maximum Feels-like |
15.7 °C |
14:24 |
11.6 °C |
17.6 °C, 2024 |
5.5 °C, 2015 |
| Mean Feels-like |
12.7 °C |
|
6.8 °C |
13.5 °C, 2024 |
1.1 °C, 2025 |
| Air-frost Hrs |
0 hrs |
|
0 hrs |
2 hrs, 2023 |
0 hrs, 2009 |
| Measure | Value (anomaly) |
Month cumul. | Record High | Record Low |
| Temperature Range |
5.1 °C (-1.4) |
5.7 °C (-0.7) |
14.2 °C (+7.7), 2012 |
2.2 °C (-4.3), 2015 |
| Humidity Range |
21% |
29% |
47%, 2010 |
15%, 2020 |
| Pressure Range |
6 hPa |
12 hPa |
16 hPa, 2017 |
3 hPa, 2014 |
| Measure | Value [% of max] |
Month cumul. | Record High | Record Low |
| Sun Hours |
0.4 [4%] | 36 hrs (68%) [23%] |
10.4 [98%], 2009 |
0 [0%], 2013 |
| Wet Hours |
4
[Mean rain rate: 0.7 mm/h] | 57 hrs (222%) [16%] |
8, 2013 |
, 2009 |
| Cloud Cover |
Overcast with periods of Mostly Cloudy |
| Events |
None |
| Comments |
top n tail Rain, 15 Shower |
| Extra Comments |
|
| Issues |
None known |
| Observer Absent? |
Yes - observations may be unreliable |
| Pond Temperature (Heath) |
n/a |


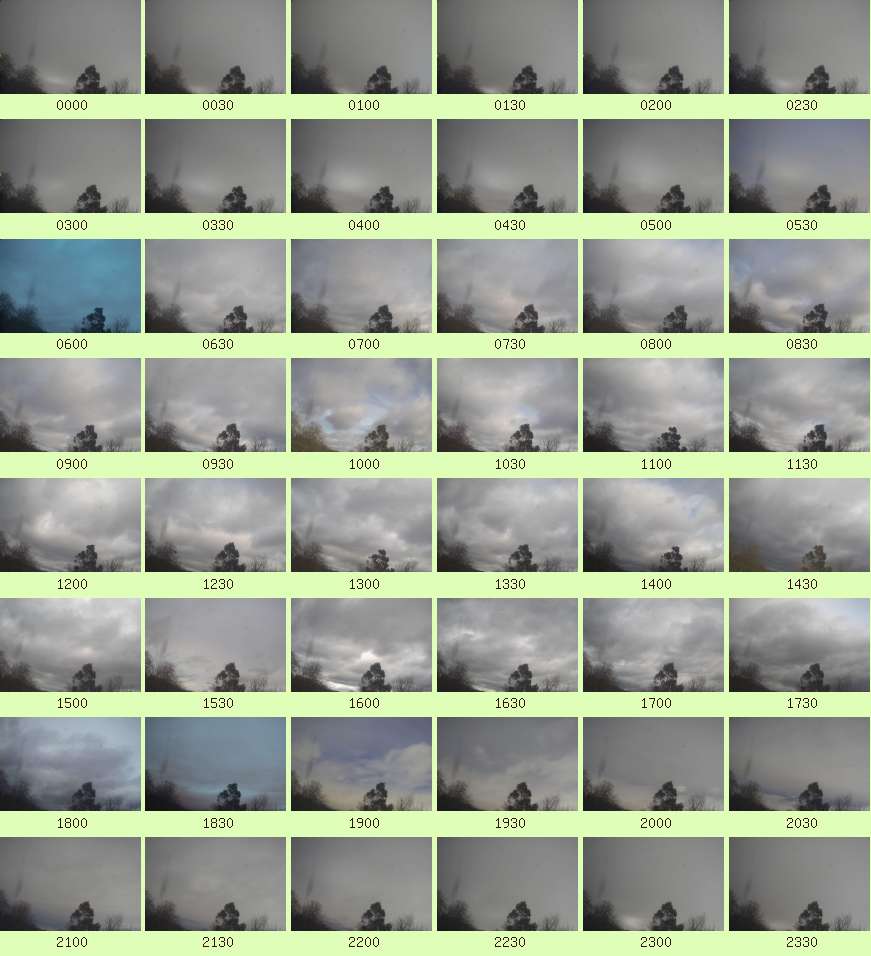 Full resolution individual images at up-to 5 minute intervals