| Measure | Value (anomaly) | Time |
Month cumul. | Record High | Record Low |
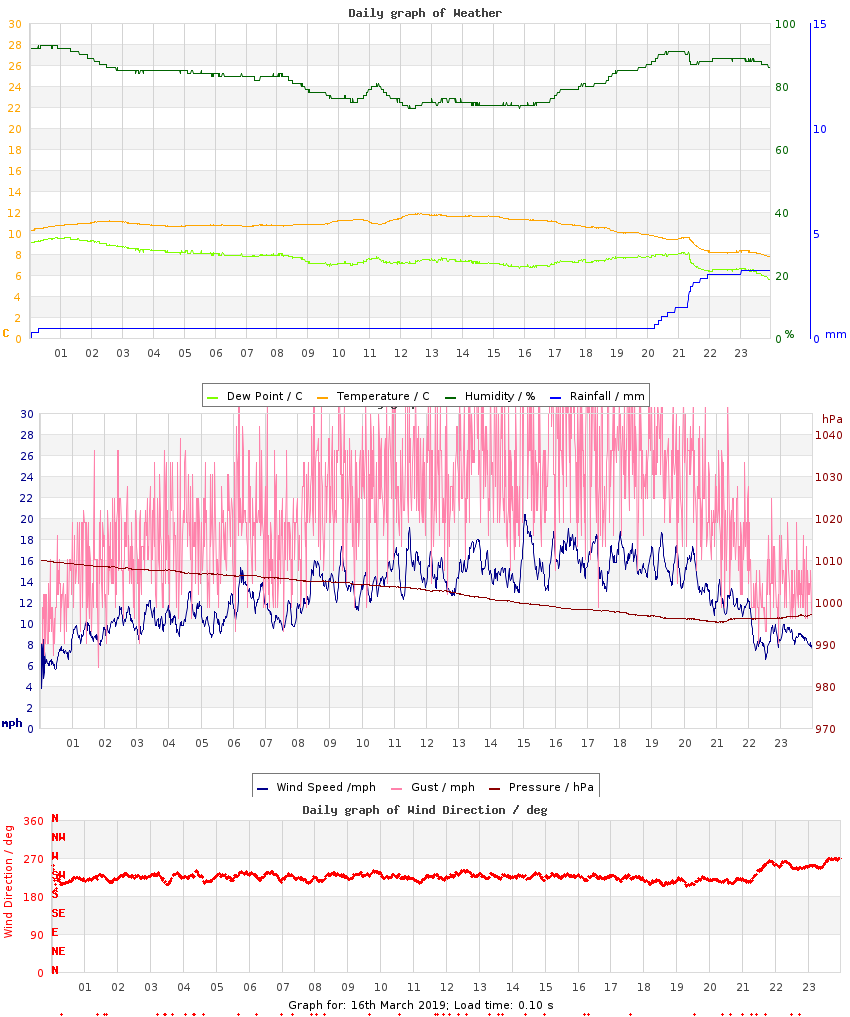
| Minimum Temperature |
7.8 °C (+3.5) |
23:55 |
6.0 °C (+2.2) |
8.3 °C (+4.0), 2012 |
-0.1 °C (-4.4), 2025 |
| Maximum Temperature |
11.9 °C (+1.0) |
12:39 |
11.6 °C (+1.3) |
18.3 °C (+7.4), 2014 |
7.8 °C (-3.1), 2013 |
| Mean Temperature |
10.6 °C (+2.2) |
|
8.9 °C (+1.7) |
13.1 °C, 2014 |
4.8 °C, 2025 |
| Minimum Humidity |
73% |
12:22 |
62% |
83%, 2022 |
36%, 2014 |
| Maximum Humidity |
93% |
00:31 |
90% |
98%, 2011 |
71%, 2010 |
| Mean Humidity |
82% |
|
79% |
92%, 2011 |
58%, 2010 |
| Minimum Pressure |
995 hPa |
21:00 |
1000 hPa |
1030 hPa, 2009 |
992 hPa, 2013 |
| Maximum Pressure |
1010 hPa |
00:00 |
1012 hPa |
1034 hPa, 2021 |
1001 hPa, 2013 |
| Mean Pressure |
1002 hPa |
|
1006 hPa |
1032 hPa, 2009 |
995 hPa, 2013 |
| Mean Wind Speed |
12.8 mph (+7.6) |
|
9.0 mph (+3.8) |
12.8 mph, 2019 |
3.3 mph, 2022 |
| Maximum Wind Speed |
27.1 mph |
16:16 |
21.8 mph |
27.1 mph, 2019 |
9.2 mph, 2010 |
| Maximum Gust |
44.9 mph |
17:26 |
36.0 mph |
44.9 mph, 2019 |
13.2 mph, 2010 |
| Mean Wind Direction |
SW |
|
|
|
|
| Rainfall |
3.5 mm |
|
46.0 mm (229%) |
7.7 mm, 2022 |
|
| Maximum Hourly Rain |
1.8 mm |
21:21 |
|
2.7 mm, 2022 |
|
| Maximum 10-min Rain |
1.1 mm |
21:24 |
|
1.5 mm, 2018 |
|
| Maximum Rain Rate |
13 mm/h |
21:19 |
|
26 mm/h, 2018 |
|
| Minimum Dew Point |
5.6 °C |
23:56 |
2.8 °C |
6.1 °C, 2023 |
-3.0 °C, 2010 |
| Maximum Dew Point |
9.6 °C |
01:13 |
7.9 °C |
10.0 °C, 2022 |
2.1 °C, 2010 |
| Mean Dew Point |
7.7 °C |
|
5.3 °C |
8.4 °C, 2023 |
-0.6 °C, 2010 |
| Measure | Value | Time |
Month cumul. | Record High | Record Low |
| Night Minimum (21-09) |
* 10.3 °C * |
00:04 |
6.6 °C |
10.3 °C, 2019 |
-0.1 °C, 2025 |
| Day Maximum (09-21) |
11.9 °C |
12:35 |
11.6 °C |
18.3 °C, 2014 |
7.8 °C, 2013 |
| Max 10m Temp Rise |
0.3 °C |
09:48 |
0.5 °C |
1.3 °C, 2009 |
0.1 °C, 2012 |
| Max 1hr Temp Rise |
1.0 °C |
12:17 |
1.6 °C |
3.5 °C, 2009 |
0.4 °C, 2012 |
| Max 1hr Hum Rise |
6% |
20:34 |
10% |
16%, 2018 |
3%, 2011 |
| Max 10m Temp Fall |
0.7 °C |
21:31 |
0.7 °C |
1.3 °C, 2018 |
0.2 °C, 2012 |
| Max 1hr Temp Fall |
1.4 °C |
22:07 |
1.6 °C |
3.3 °C, 2021 |
0.4 °C, 2012 |
| Max 1hr Hum Fall |
8% |
12:17 |
10% |
22%, 2014 |
3%, 2022 |
| Max 10m Wind Speed |
20.4 mph |
15:04 |
16.3 mph |
20.4 mph, 2019 |
6.2 mph, 2010 |
| Minimum Feels-like |
3.7 °C |
21:53 |
1.6 °C |
5.9 °C, 2014 |
-5.6 °C, 2025 |
| Maximum Feels-like |
12.1 °C |
13:20 |
11.6 °C |
18.3 °C, 2014 |
6.2 °C, 2013 |
| Mean Feels-like |
10.2 °C |
|
7.0 °C |
12.7 °C, 2014 |
1.9 °C, 2025 |
| Air-frost Hrs |
0 hrs |
|
0 hrs |
0.1 hrs, 2025 |
0 hrs, 2009 |
| Measure | Value (anomaly) |
Month cumul. | Record High | Record Low |
| Temperature Range |
4.1 °C (-2.4) |
5.6 °C (-0.8) |
13.0 °C (+6.5), 2009 |
1.5 °C (-5.0), 2012 |
| Humidity Range |
20% |
28% |
47%, 2009 |
10%, 2022 |
| Pressure Range |
15 hPa |
12 hPa |
15 hPa, 2019 |
3 hPa, 2009 |
| Measure | Value [% of max] |
Month cumul. | Record High | Record Low |
| Sun Hours |
0 [0%] | 36 hrs (64%) [22%] |
10.7 [100%], 2014 |
0 [0%], 2011 |
| Wet Hours |
4
[Mean rain rate: 0.9 mm/h] | 61 hrs (223%) [16%] |
9, 2022 |
, 2009 |
| Cloud Cover |
Overcast |
| Events |
None |
| Comments |
top n tail Rain, 11 Shower |
| Extra Comments |
|
| Issues |
None known |
| Observer Absent? |
Yes - observations may be unreliable |
| Pond Temperature (Heath) |
n/a |


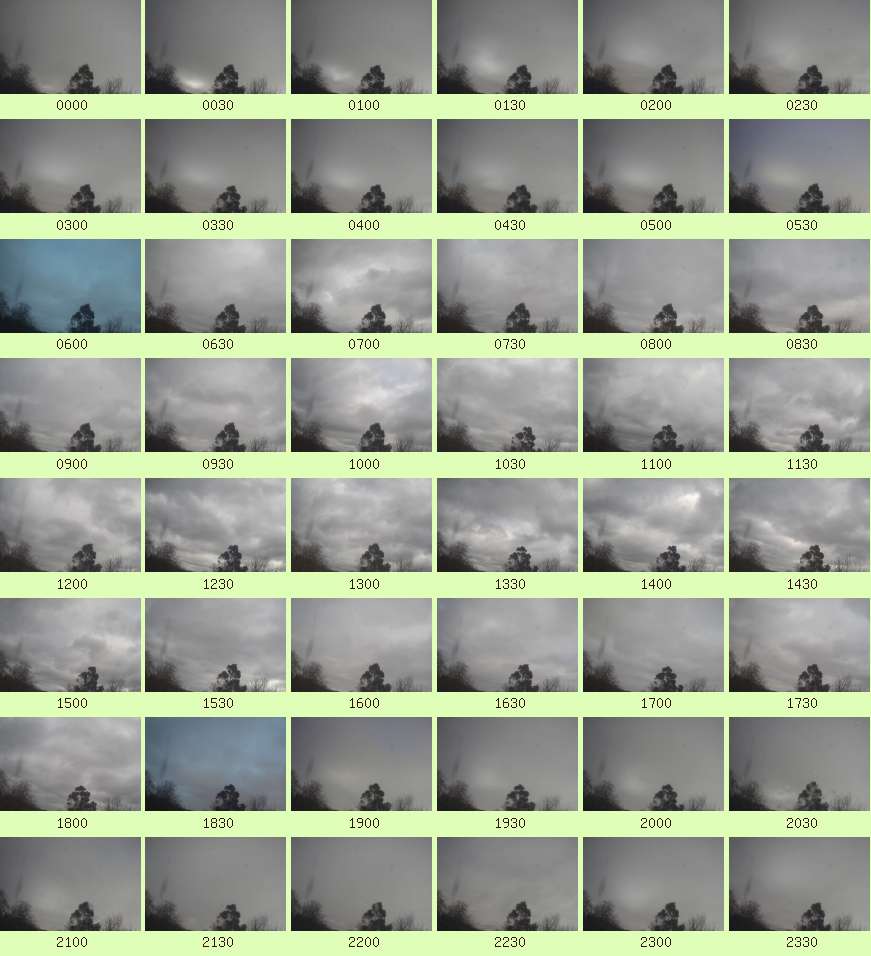 Full resolution individual images at up-to 5 minute intervals