| Measure | Value (anomaly) | Time |
Month cumul. | Record High | Record Low |
| Minimum Temperature |
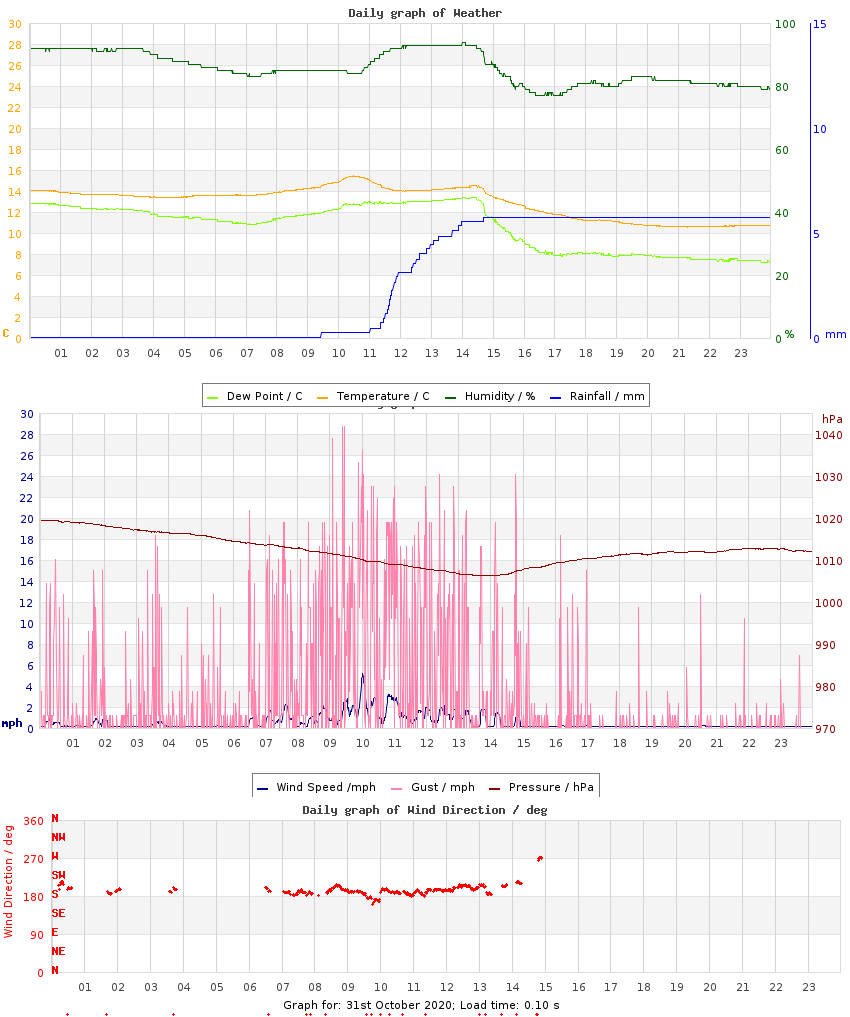
10.5 °C (+3.5) |
21:17 |
8.8 °C (+0.3) |
13.4 °C (+6.4), 2014 |
-0.8 °C (-7.8), 2018 |
| Maximum Temperature |
15.5 °C (+2.9) |
10:28 |
14.1 °C (-0.5) |
21.3 °C (+8.7), 2014 |
10.9 °C (-1.7), 2019 |
| Mean Temperature |
13.0 °C (+3.2) |
|
11.4 °C (-0.1) |
16.7 °C, 2014 |
6.8 °C, 2018 |
| Minimum Humidity |
77% |
16:31 |
75% |
85%, 2010 |
54%, 2014 |
| Maximum Humidity |
94% |
14:02 |
93% |
98%, 2009 |
81%, 2016 |
| Mean Humidity |
86% |
|
87% |
94%, 2009 |
77%, 2012 |
| Minimum Pressure |
1006 hPa |
13:36 |
1005 hPa |
1025 hPa, 2024 |
978 hPa, 2012 |
| Maximum Pressure |
1020 hPa |
00:01 |
1013 hPa |
1030 hPa, 2017 |
999 hPa, 2012 |
| Mean Pressure |
1012 hPa |
|
1009 hPa |
1028 hPa, 2024 |
989 hPa, 2012 |
| Mean Wind Speed |
5.7 mph (+1.6) |
|
3.8 mph (-0.3) |
9.6 mph, 2021 |
0.5 mph, 2016 |
| Maximum Wind Speed |
10.8 mph |
09:57 |
13.0 mph |
22.4 mph, 2021 |
5.0 mph, 2024 |
| Maximum Gust |
28.8 mph |
09:24 |
22.2 mph |
36.5 mph, 2021 |
8.1 mph, 2024 |
| Mean Wind Direction |
SSW |
|
|
|
|
| Rainfall |
6.6 mm |
|
165.8 mm (255%) |
7.2 mm, 2021 |
|
| Maximum Hourly Rain |
2.9 mm |
11:56 |
|
3.8 mm, 2021 |
|
| Maximum 10-min Rain |
1.1 mm |
11:43 |
|
1.2 mm, 2021 |
|
| Maximum Rain Rate |
18 mm/h |
11:39 |
|
18 mm/h, 2020 |
|
| Minimum Dew Point |
7.2 °C |
23:46 |
6.9 °C |
11.0 °C, 2014 |
-2.0 °C, 2018 |
| Maximum Dew Point |
13.4 °C |
14:22 |
11.2 °C |
16.8 °C, 2009 |
7.4 °C, 2019 |
| Mean Dew Point |
10.7 °C |
|
9.2 °C |
13.1 °C, 2014 |
3.6 °C, 2018 |
| Measure | Value | Time |
Month cumul. | Record High | Record Low |
| Night Minimum (21-09) |
* 13.4 °C * |
04:29 |
9.2 °C |
15.2 °C, 2011 |
-0.8 °C, 2018 |
| Day Maximum (09-21) |
15.5 °C |
10:28 |
14.1 °C |
21.3 °C, 2014 |
10.9 °C, 2019 |
| Max 10m Temp Rise |
0.4 °C |
10:14 |
0.4 °C |
1.1 °C, 2016 |
0.2 °C, 2010 |
| Max 1hr Temp Rise |
1.0 °C |
10:18 |
1.4 °C |
4.5 °C, 2018 |
0.4 °C, 2013 |
| Max 1hr Hum Rise |
8% |
11:40 |
6% |
10%, 2021 |
3%, 2010 |
| Max 10m Temp Fall |
0.6 °C |
14:49 |
0.5 °C |
1.0 °C, 2021 |
0.2 °C, 2010 |
| Max 1hr Temp Fall |
1.6 °C |
15:31 |
1.2 °C |
2.4 °C, 2016 |
0.6 °C, 2012 |
| Max 1hr Hum Fall |
11% |
15:36 |
7% |
15%, 2009 |
3%, 2010 |
| Max 10m Wind Speed |
5.2 mph |
10:01 |
8.3 mph |
17.5 mph, 2021 |
3.3 mph, 2024 |
| Minimum Feels-like |
10.7 °C |
22:16 |
7.4 °C |
16.0 °C, 2014 |
-0.8 °C, 2018 |
| Maximum Feels-like |
18.2 °C |
10:28 |
15.8 °C |
25.0 °C, 2014 |
11.0 °C, 2019 |
| Mean Feels-like |
14.6 °C |
|
12.0 °C |
19.6 °C, 2014 |
6.5 °C, 2018 |
| Air-frost Hrs |
0 hrs |
|
0 hrs |
3 hrs, 2018 |
0 hrs, 2009 |
| Measure | Value (anomaly) |
Month cumul. | Record High | Record Low |
| Temperature Range |
5.0 °C (-0.6) |
5.3 °C (-0.8) |
13.3 °C (+7.7), 2018 |
1.6 °C (-4.0), 2013 |
| Humidity Range |
17% |
18% |
42%, 2014 |
10%, 2016 |
| Pressure Range |
13 hPa |
8 hPa |
21 hPa, 2012 |
3 hPa, 2009 |
| Measure | Value [% of max] |
Month cumul. | Record High | Record Low |
| Sun Hours |
1.4 [16%] | 70 hrs (60%) [24%] |
8 [92%], 2018 |
0 [0%], 2013 |
| Wet Hours |
5
[Mean rain rate: 1.3 mm/h] | 132 hrs (268%) [18%] |
5, 2020 |
0, 2011 |
| Cloud Cover |
Overcast with periods of Mostly Sunny |
| Events |
None |
| Comments |
day rn |
| Extra Comments |
|
| Issues |
wind sensor not reporting properly - v low speeds |
| Observer Absent? |
Yes - observations may be unreliable |
| Pond Temperature (Heath) |
9.5 °C |


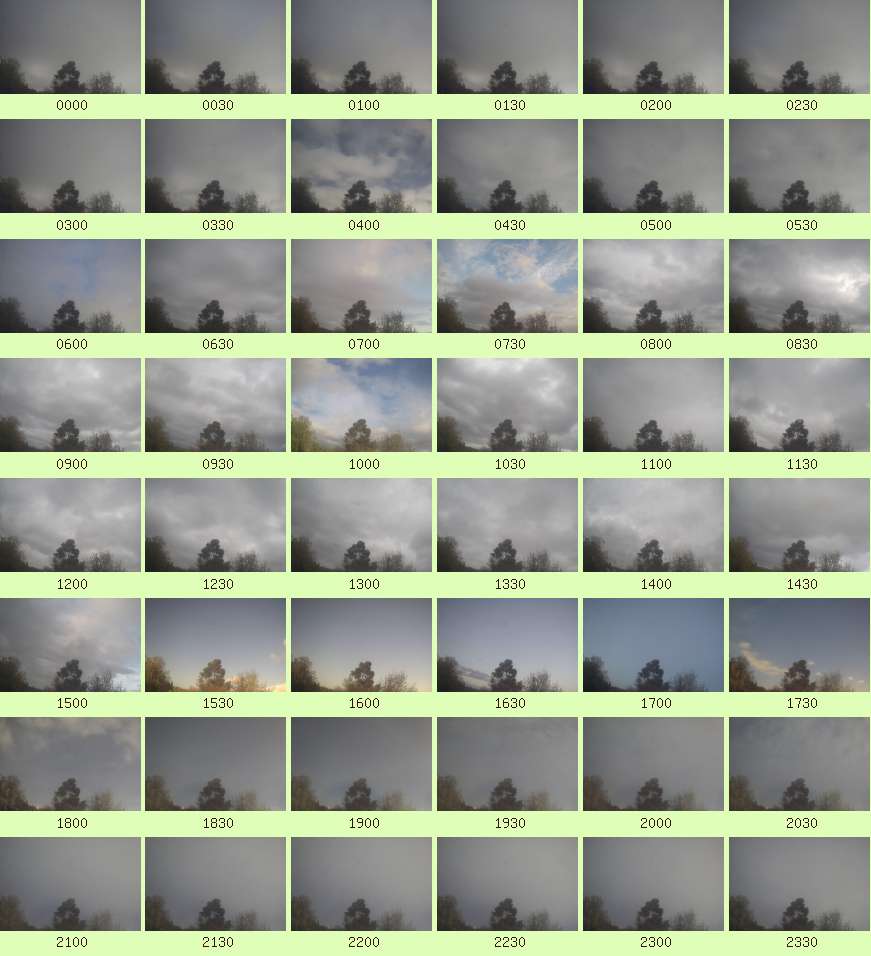 Full resolution individual images at up-to 5 minute intervals