| Measure | Value (anomaly) | Time |
Month cumul. | Record High | Record Low |
| Minimum Temperature |
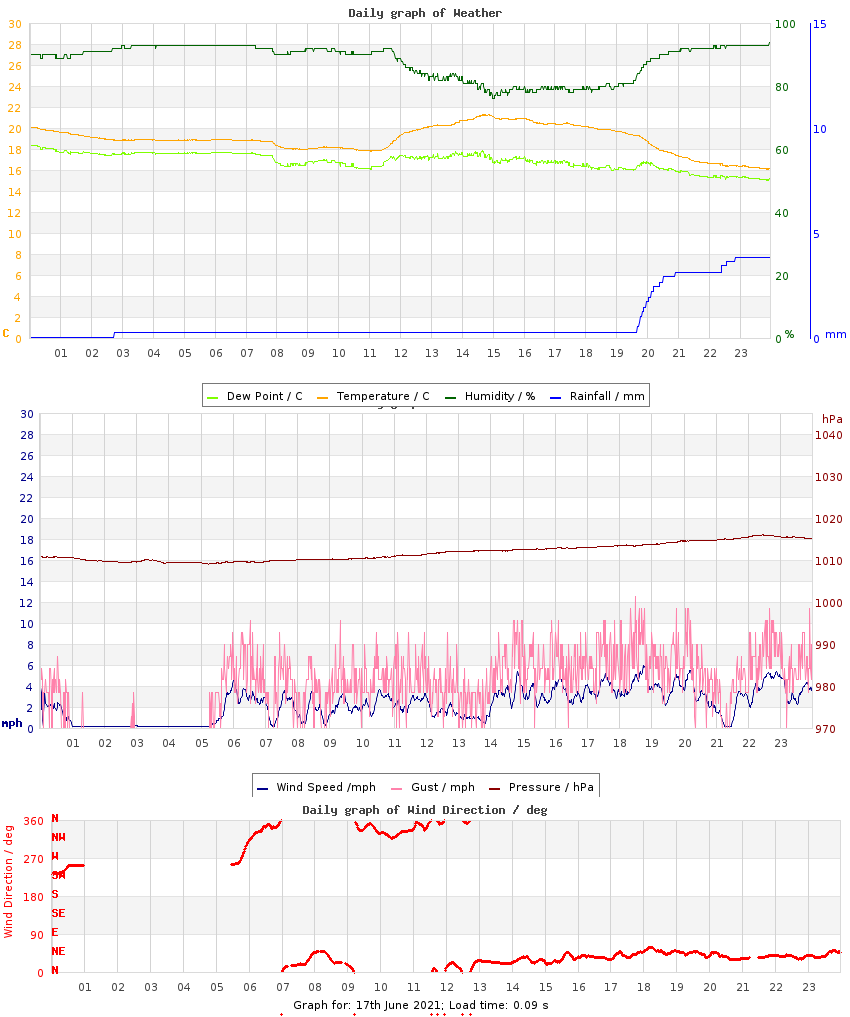
16.1 °C (+4.0) |
23:52 |
14.2 °C (+2.6) |
16.4 °C (+4.3), 2022 |
8.3 °C (-3.8), 2010 |
| Maximum Temperature |
21.3 °C (+0.2) |
14:42 |
24.8 °C (+4.4) |
31.9 °C (+10.8), 2022 |
14.8 °C (-6.3), 2011 |
| Mean Temperature |
19.0 °C (+2.1) |
|
19.7 °C (+3.5) |
25.1 °C, 2022 |
12.5 °C, 2011 |
| Minimum Humidity |
76% |
15:00 |
49% |
76%, 2021 |
35%, 2010 |
| Maximum Humidity |
94% |
23:57 |
87% |
95%, 2011 |
77%, 2015 |
| Mean Humidity |
88% |
|
69% |
88%, 2021 |
54%, 2022 |
| Minimum Pressure |
1009 hPa |
05:13 |
1019 hPa |
1026 hPa, 2014 |
995 hPa, 2011 |
| Maximum Pressure |
1016 hPa |
22:24 |
1023 hPa |
1029 hPa, 2025 |
1011 hPa, 2011 |
| Mean Pressure |
1012 hPa |
|
1021 hPa |
1027 hPa, 2014 |
1003 hPa, 2011 |
| Mean Wind Speed |
2.2 mph (-2.2) |
|
2.7 mph (-1.7) |
7.1 mph, 2015 |
1.3 mph, 2020 |
| Maximum Wind Speed |
7.6 mph |
18:46 |
10.0 mph |
17.0 mph, 2019 |
7.6 mph, 2021 |
| Maximum Gust |
12.5 mph |
18:29 |
15.4 mph |
26.6 mph, 2015 |
11.5 mph, 2017 |
| Mean Wind Direction |
NNE |
|
|
|
|
| Rainfall |
3.8 mm |
|
17.0 mm (64%) |
7.6 mm, 2011 |
|
| Maximum Hourly Rain |
2.7 mm |
20:31 |
|
5.5 mm, 2016 |
|
| Maximum 10-min Rain |
0.9 mm |
19:53 |
|
3.1 mm, 2016 |
|
| Maximum Rain Rate |
7 mm/h |
19:46 |
|
54 mm/h, 2016 |
|
| Minimum Dew Point |
15.0 °C |
23:52 |
10.6 °C |
15.0 °C, 2021 |
3.8 °C, 2014 |
| Maximum Dew Point |
18.5 °C |
00:01 |
16.1 °C |
18.5 °C, 2021 |
9.6 °C, 2014 |
| Mean Dew Point |
16.9 °C |
|
13.5 °C |
16.9 °C, 2021 |
8.0 °C, 2014 |
| Measure | Value | Time |
Month cumul. | Record High | Record Low |
| Night Minimum (21-09) |
* 18.0 °C * |
08:44 |
14.4 °C |
18.0 °C, 2021 |
8.3 °C, 2010 |
| Day Maximum (09-21) |
21.3 °C |
14:46 |
24.7 °C |
31.9 °C, 2022 |
14.8 °C, 2011 |
| Max 10m Temp Rise |
0.6 °C |
12:01 |
0.6 °C |
0.9 °C, 2022 |
0.3 °C, 2011 |
| Max 1hr Temp Rise |
1.9 °C |
12:24 |
2.3 °C |
3.8 °C, 2022 |
1.2 °C, 2011 |
| Max 1hr Hum Rise |
9% |
20:13 |
9% |
23%, 2024 |
7%, 2011 |
| Max 10m Temp Fall |
0.4 °C |
19:54 |
0.6 °C |
0.8 °C, 2016 |
0.3 °C, 2013 |
| Max 1hr Temp Fall |
1.6 °C |
20:39 |
1.9 °C |
2.4 °C, 2017 |
1.1 °C, 2013 |
| Max 1hr Hum Fall |
9% |
12:41 |
12% |
23%, 2022 |
7%, 2009 |
| Max 10m Wind Speed |
5.9 mph |
18:44 |
7.5 mph |
14.0 mph, 2022 |
5.5 mph, 2020 |
| Minimum Feels-like |
20.1 °C |
23:52 |
16.3 °C |
20.1 °C, 2021 |
6.9 °C, 2010 |
| Maximum Feels-like |
27.2 °C |
14:40 |
28.6 °C |
37.5 °C, 2022 |
16.2 °C, 2011 |
| Mean Feels-like |
24.2 °C |
|
22.9 °C |
29.0 °C, 2022 |
13.8 °C, 2011 |
| Air-frost Hrs |
0 hrs |
|
0 hrs |
0 hrs, 2009 |
0 hrs, 2009 |
| Measure | Value (anomaly) |
Month cumul. | Record High | Record Low |
| Temperature Range |
5.2 °C (-3.8) |
10.6 °C (+1.7) |
15.5 °C (+6.5), 2022 |
4.9 °C (-4.1), 2011 |
| Humidity Range |
18% |
38% |
50%, 2010 |
18%, 2021 |
| Pressure Range |
7 hPa |
4 hPa |
16 hPa, 2011 |
2 hPa, 2020 |
| Measure | Value [% of max] |
Month cumul. | Record High | Record Low |
| Sun Hours |
0.1 [1%] | 144 hrs (132%) [57%] |
13.7 [91%], 2025 |
0.1 [1%], 2021 |
| Wet Hours |
5
[Mean rain rate: 0.8 mm/h] | 16 hrs (76%) [3.9%] |
7, 2011 |
0, 2010 |
| Cloud Cover |
Overcast |
| Events |
None |
| Comments |
bits of day rain, late rain |
| Extra Comments |
|
| Issues |
None known |
| Observer Absent? |
Yes - observations may be unreliable |
| Pond Temperature (Heath) |
20.0 °C |


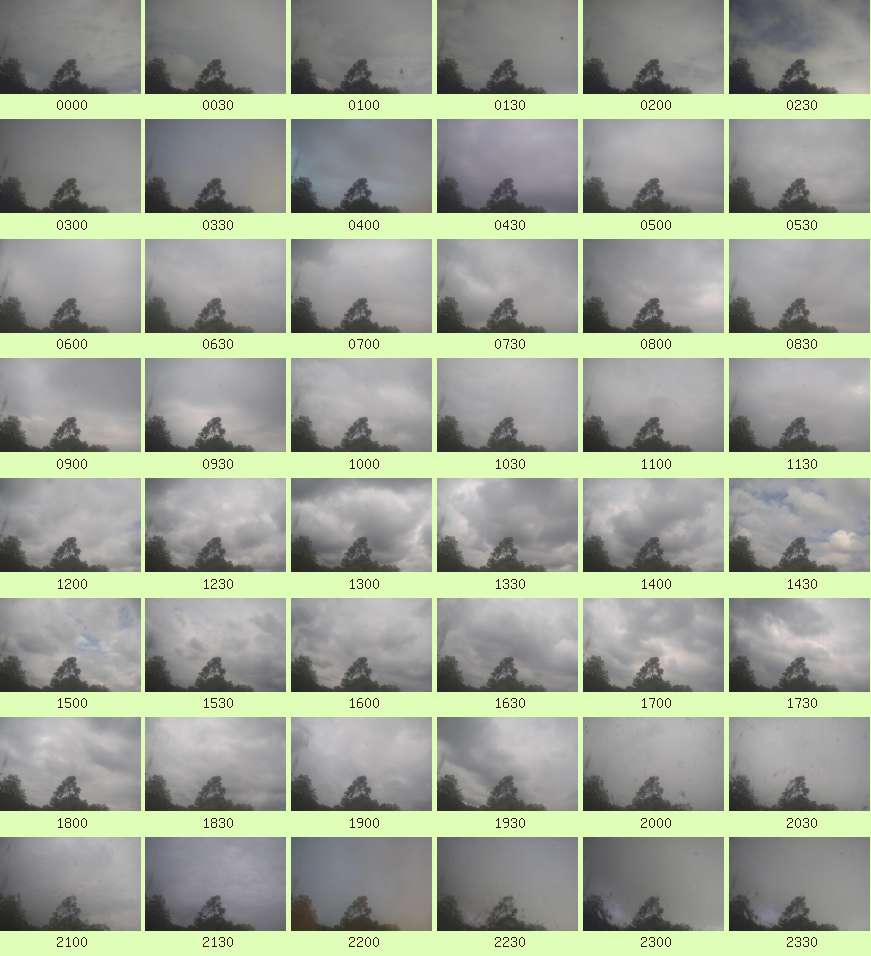 Full resolution individual images at up-to 5 minute intervals