| Measure | Value (anomaly) | Time |
Month cumul. | Record High | Record Low |
| Minimum Temperature |
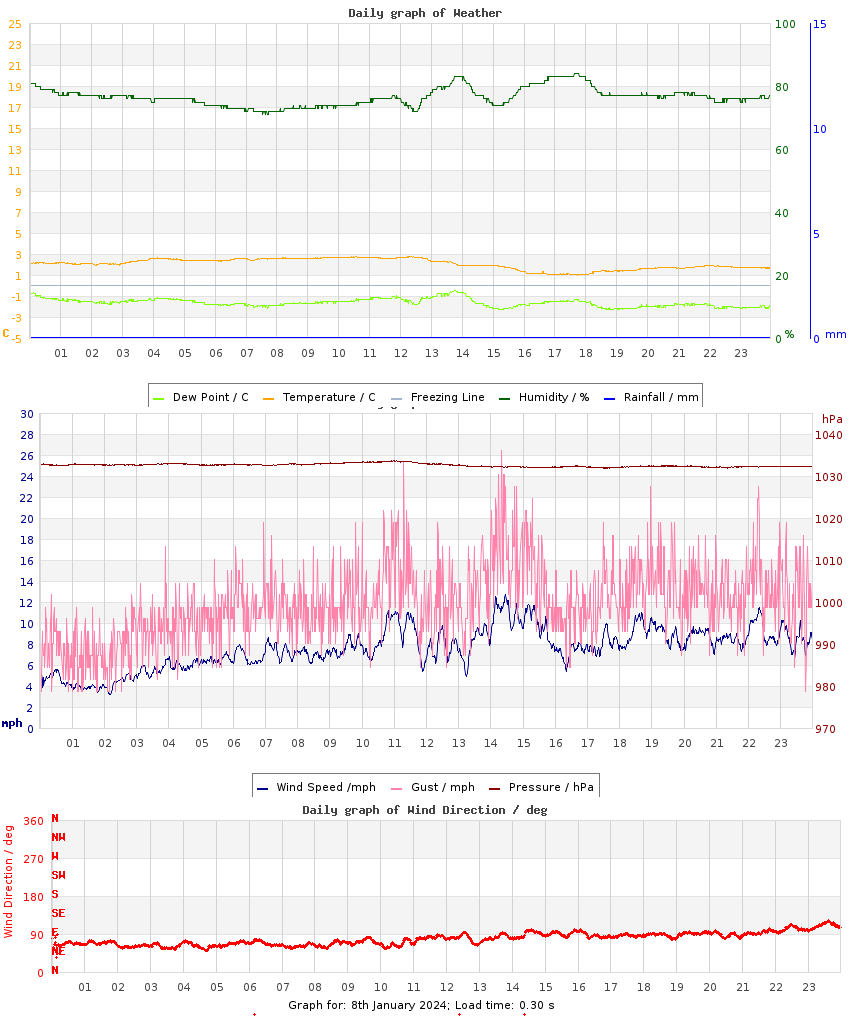
1.0 °C (-2.1) |
17:44 |
5.0 °C (+1.9) |
9.9 °C (+6.8), 2020 |
-3.3 °C (-6.4), 2010 |
| Maximum Temperature |
2.8 °C (-5.0) |
12:19 |
7.9 °C (+0.1) |
12.3 °C (+4.5), 2020 |
0.2 °C (-7.6), 2010 |
| Mean Temperature |
2.1 °C (-3.6) |
|
6.4 °C (+1.0) |
11.4 °C, 2020 |
-1.9 °C, 2010 |
| Minimum Humidity |
71% |
07:42 |
80% |
90%, 2021 |
62%, 2012 |
| Maximum Humidity |
84% |
17:41 |
93% |
97%, 2010 |
83%, 2019 |
| Mean Humidity |
77% |
|
86% |
93%, 2010 |
70%, 2012 |
| Minimum Pressure |
1032 hPa |
17:31 |
1001 hPa |
1032 hPa, 2024 |
988 hPa, 2011 |
| Maximum Pressure |
1034 hPa |
11:03 |
1013 hPa |
1034 hPa, 2017 |
998 hPa, 2023 |
| Mean Pressure |
1033 hPa |
|
1007 hPa |
1033 hPa, 2024 |
993 hPa, 2023 |
| Mean Wind Speed |
7.6 mph (+2.4) |
|
6.6 mph (+1.4) |
7.8 mph, 2023 |
0.9 mph, 2017 |
| Maximum Wind Speed |
17.5 mph |
14:08 |
17.0 mph |
19.9 mph, 2011 |
4.9 mph, 2017 |
| Maximum Gust |
26.5 mph |
14:20 |
26.8 mph |
33.1 mph, 2011 |
8.4 mph, 2017 |
| Mean Wind Direction |
E |
|
|
|
|
| Rainfall / Snow-melt approx. |
trace |
|
37.6 mm (247%) |
15.8, 2015 |
|
| Maximum Hourly Rain |
n/a |
|
|
4.8, 2015 |
|
| Maximum 10-min Rain |
n/a |
|
|
2, 2015 |
|
| Maximum Rain Rate |
n/a |
|
|
24, 2015 |
|
| Minimum Dew Point |
-2.3 °C |
18:48 |
2.9 °C |
8.1 °C, 2020 |
-4.1 °C, 2010 |
| Maximum Dew Point |
-0.5 °C |
13:45 |
6.0 °C |
11.2 °C, 2020 |
-0.9 °C, 2010 |
| Mean Dew Point |
-1.6 °C |
|
4.3 °C |
9.2 °C, 2020 |
-2.8 °C, 2010 |
| Measure | Value | Time |
Month cumul. | Record High | Record Low |
| Night Minimum (21-09) |
* 1.9 °C * |
02:30 |
5.3 °C |
11.1 °C, 2020 |
-3.3 °C, 2010 |
| Day Maximum (09-21) |
2.8 °C |
11:25 |
7.7 °C |
11.9 °C, 2020 |
0.2 °C, 2010 |
| Max 10m Temp Rise |
0.2 °C |
02:17 |
0.3 °C |
0.5 °C, 2023 |
0.1 °C, 2012 |
| Max 1hr Temp Rise |
0.7 °C |
03:53 |
0.9 °C |
1.7 °C, 2023 |
0.4 °C, 2012 |
| Max 1hr Hum Rise |
8% |
13:24 |
5% |
8%, 2024 |
1%, 2017 |
| Max 10m Temp Fall |
0.3 °C |
12:59 |
0.3 °C |
0.7 °C, 2023 |
0.2 °C, 2010 |
| Max 1hr Temp Fall |
0.7 °C |
13:51 |
1.0 °C |
1.9 °C, 2023 |
0.3 °C, 2018 |
| Max 1hr Hum Fall |
9% |
14:58 |
6% |
9%, 2011 |
1%, 2017 |
| Max 10m Wind Speed |
12.8 mph |
14:27 |
12.9 mph |
13.3 mph, 2011 |
4.3 mph, 2017 |
| Minimum Feels-like |
-5.3 °C |
18:58 |
0.6 °C |
7.7 °C, 2017 |
-8.9 °C, 2010 |
| Maximum Feels-like |
0.6 °C |
00:22 |
7.8 °C |
14.2 °C, 2020 |
0.2 °C, 2010 |
| Mean Feels-like |
-2.4 °C |
|
4.2 °C |
12.2 °C, 2020 |
-5.4 °C, 2010 |
| Air-frost Hrs |
0 hrs |
|
0 hrs |
22 hrs, 2010 |
0 hrs, 2011 |
| Measure | Value (anomaly) |
Month cumul. | Record High | Record Low |
| Temperature Range |
1.8 °C (-2.9) |
2.8 °C (-1.8) |
8.6 °C (+3.9), 2022 |
1.5 °C (-3.2), 2012 |
| Humidity Range |
13% |
13% |
28%, 2011 |
2%, 2017 |
| Pressure Range |
2 hPa |
12 hPa |
22 hPa, 2022 |
2 hPa, 2024 |
| Measure | Value [% of max] |
Month cumul. | Record High | Record Low |
| Sun Hours |
0.1 [1%] | 9.6 hrs (57%) [17%] |
6 [83%], 2019 |
0 [0%], 2018 |
| Wet Hours |
0.5 | 30 hrs (171%) [15%] |
7, 2015 |
, 2009 |
| Cloud Cover |
unknown |
| Events |
Snowfall: ~0 cm
Lying Snow (at 09z): trace amount |
| Comments |
some pm sn shs with slight |
| Extra Comments |
|
| Issues |
None known |
| Observer Absent? |
Yes - observations may be unreliable |
| Pond Temperature (Heath) |
6.0 °C |


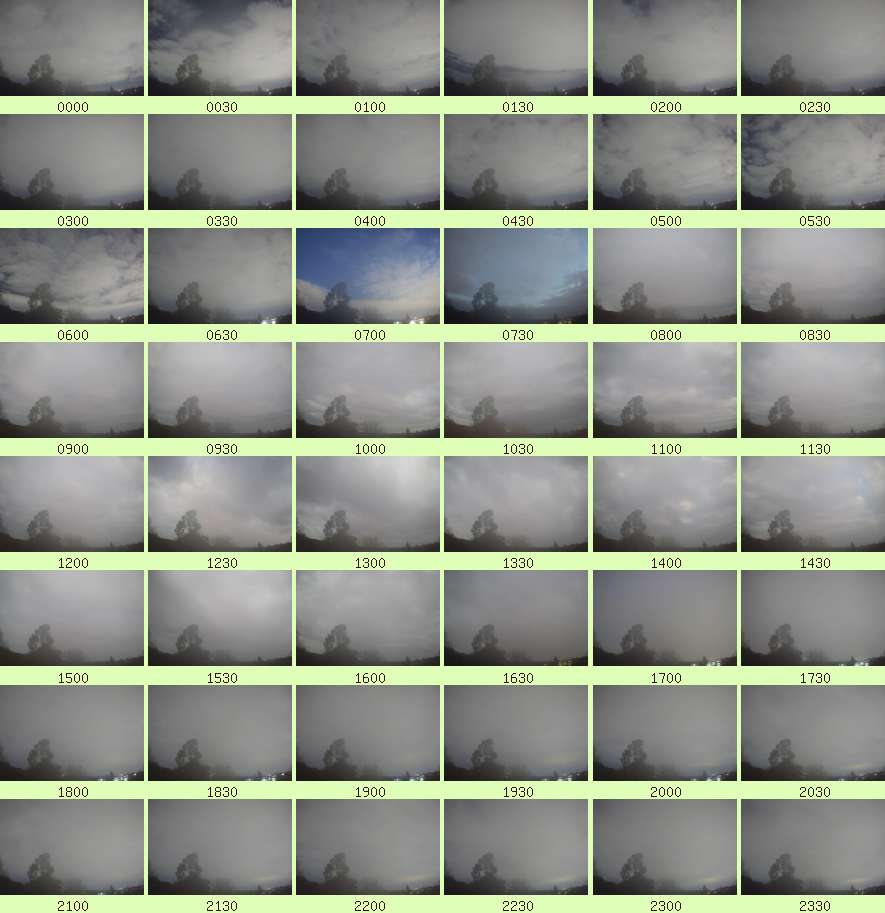 Full resolution individual images at up-to 5 minute intervals